Track. Measure. Grow.
An Insider’s Guide to RFP Metrics That Matter
A guide for proposal teams who want to make smarter decisions, win more RFPs, and elevate their work.

Here’s what you’ll learn
Ready to get started? Download your RFP analytics template.
Like a trusted advisor, request for proposal (RFP) metrics exist to guide your decisions. They offer insight into what’s working, what’s not, and your top opportunities to improve.
But just because you can measure something, doesn't mean you should. That’s why this guide focuses on teaching you how to track the 22 RFP metrics that actually matter.
It shares everyday insights—like the number of RFPs submitted—to advanced metrics, including team bandwidth or proposal progression forecasts. You’ll learn how to make small improvements to your daily work, position yourself as a strategic revenue driver, and, ultimately, advance your career.

Chapter 1. What Are RFP Metrics?
RFP metrics are the numbers you can track to better understand how your RFP program is performing. For example, of the RFPs you send, how many do you win? Or of your contributors, how many get their submissions in on time, and how often?
There are five groups of RFP tracking metrics:
Each can tell you something different and specific about your work and proposal program.
But regardless of which RFP metrics you’re after, there are general principles that apply across all. In this chapter, we’ll help you select metrics that’ll form the foundation of your RFP analytics.
How to Select Your RFP Metrics
The first step in collecting good RFP data is to confirm the goals of your program. To drive revenue, yes, but you can be more specific. Is your revenue goal S.M.A.R.T?
S – Specific
M – Measurable
A – Attainable
R – Realistic
T – Time-bound
When setting goals, think about the outcomes that you want to achieve. Do you want to submit all RFPs on time? Do you want the RFP team members to thrive and grow in their roles? Do you want to retain a significant number of existing clients? Answer these questions when writing down your final goals.
1. Set RFP Program Goals
Now that you know what you want to achieve, make sure to incorporate a mix of short-term goals for your department, as well as long-term goals that contribute to the business.
| Short-Term Department Goal | Long-Term Business Goal |
| This week, I must complete 10 RFPs | This year, we must win 60% of our RFPs for a total of $1.5M in revenue |
| This month, we must meet our internal SLAs for RFP completion for at least 95% of projects | We need to retain 88% of existing customers through RFPs this year |
It’s important to differentiate between departmental goals and those of the broader business to keep your team satisfied. The reason: If your team can’t affect some of those goals, but they’re still held to them, they can feel demotivated.
This often happens with win rates. Winning is so dependent upon the skills of a salesperson that it’s difficult for proposal teams to carry the full responsibility of that metric alone.
Reference the chart above and include a mix of both goals for balance. Look at departmental goals to identify what you and your team can change. Look at business goals to tell you what the company needs to change. Both should be used to achieve RFP success.
2. Different Types of Proposal Metrics
With your goals in hand—those primary things you want to achieve—generate a list of problems you need to solve to reach them. You can measure each problem with a metric found in this guide.
| Problem to solve | Type of metric to address it |
| SMEs always submit their RFP responses late | Time to the second draft |
| No visibility into why we win | Content performance |
| No sense of what’s going to close | Advancement rate |
| Need to save time to respond to more RFPs | Time to the first draft |
Build your list of the RFP metrics that, in an ideal world, you’d like to track because they provide answers that lead to data-driven decisions that can impact change.

Chapter 2. Tracking RFP Volume
Volume metrics form the baseline upon which other RFP metrics are built. They are something every organization should track, no matter how small they are, such as how many RFPs they receive and how many they complete.
While not particularly insightful when taken alone, volume metrics are very helpful when combined with other RFP metrics. For instance, knowing that you reply to 30 RFPs per year doesn’t tell you much. But knowing that you reply to 30 RFPs, with a team capacity of 25, suggests you are overworked. Those numbers help you make a data-driven case for more resources.
There are three volume metrics to track:
RFPs Received (#)
This is the total number of RFPs your team receives over a period of time.
The volume puts all your other RFP metrics into context, especially those around workload, and it can reveal your velocity, which shows whether the rate at which you’re receiving RFPs is speeding up or slowing down.
✓ How to track it:
- Track volume automatically through an intake form
- Ideally, you’ll sync your form to a customer relationship management (CRM) tool
- Alternatively, you can keep track of this metric through Google forms and a spreadsheet
- Whichever method you use, add a dashboard that organizes by your short-term vs. long-term goals
✓ Decisions you can make with it:
- Determine whether RFPs are currently important to your business
- Determine whether the volume is increasing or decreasing (if tracked over time)
- Determine whether you have enough RFP pipeline (if tracked over time)

How many RFPs do companies normally receive?
According to Loopio’s 2021 RFP Response Trends & Benchmarks Report, which contains research from 650+ teams across North America, companies receive an average of 230 RFPs annually.
RFPs Submitted (#)
This is the number of RFPs your organization responds to.
It helps you understand your team’s output, or how many proposal replies you’re sending. This metric is most helpful when compared to other workload metrics. For example, knowing that the number of RFPs submitted exceeds your team’s workload, which may demonstrate that you’ve been working overtime.
✓ How to track it:
- Track the same way you track RFPs received—in a CRM like Salesforce
- You can also track by monitoring projects marked “100% complete” in a proposal software
- If you don’t have access to either of these tools, use a shared spreadsheet with your team
✓ Decisions you can make with it:
- Determine whether you’re responding to a healthy percentage of the RFPs you’ve received
- Determine if your team is overworked (if you know your team’s maximum workload)
- Determine if you need more resources (if this number is lower than your goal)
How many RFPs do companies submit?
The average business submits 150 RFPs annually. However, this varies by company size.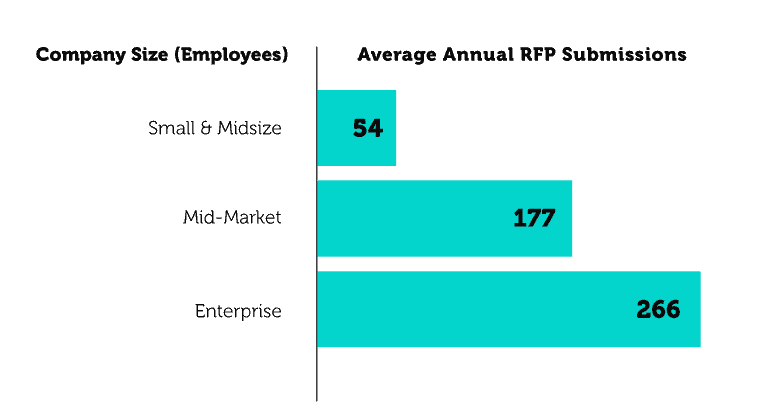
Source: Loopio’s 2021 RFP Response Trends & Benchmarks Report
RFP Participation Rate (%)
This is the percentage of RFPs you receive that you respond to.
This tells you how many of the RFPs you actually participate in. Or, how many proposals receive the “go” designation from a go/no-go process, a framework that helps RFP teams make quick decisions about which bids to respond to.
If you record why you decline each RFP, you’ll be able to look back at the reasons in aggregate to determine if your response rate is healthy for your business. If you find that many of the RFPs you declined weren’t a fit, your team doesn’t feel overworked, and you’re hitting your win-rate goal, your present participation level is probably a good benchmark.
✓ How to track it:
- Divide RFPs received by RFPs submitted and multiply the result by 100
- You can set this up in a custom CRM dashboard, or in a pinch, use a spreadsheet
✓ Decisions you can make with it:
- Whether you’re responding to enough RFPs to meet your revenue targets
- Whether you need more resources (if this rate is low)
- Whether you need to alter your go/no-go standards
What is a normal RFP participation rate?
On average, companies participate in 65% of the RFPs they receive.
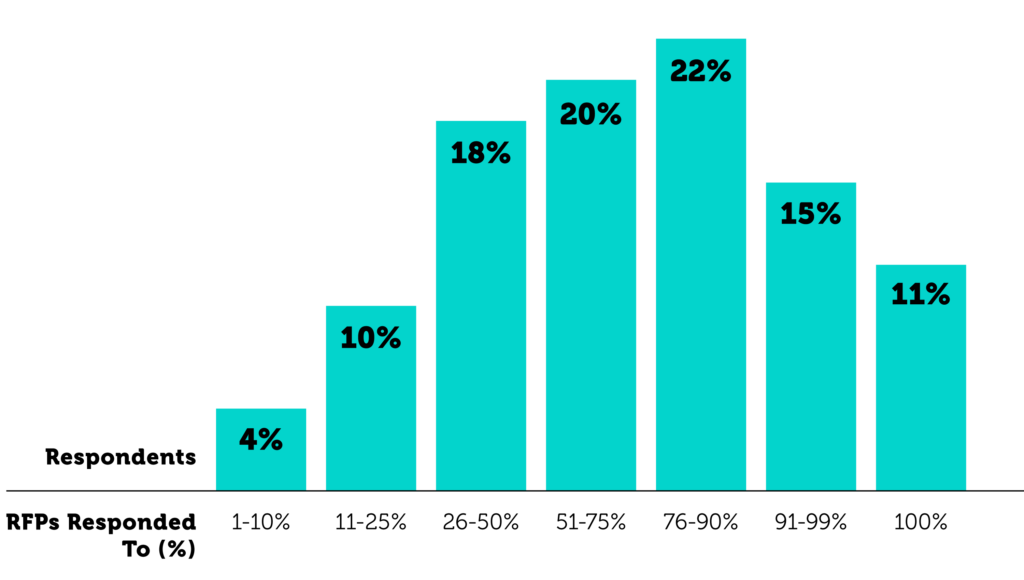
Source: Loopio’s 2021 RFP Response Trends & Benchmarks Report

Chapter 3. Tracking Revenue (Thinking Beyond Win Rates)
Revenue can be a fraught topic in the RFP world. While your overall goal may be to drive revenue, tracking only that will cause you to miss all the work that goes into the submission. You can have a talented RFP org putting out quality work that still loses the majority of the time.
That’s because revenue metrics are a lagging indicator for proposal teams. You often don’t know you’ve succeeded at generating revenue until months later (or even a full year in some industries). For these reasons, it’s important to balance revenue insights with metrics that your team can impact now, like how efficiently your team prepares and delivers a proposal.
There are six revenue metrics we recommend tracking:
RFP Win Rate (%)
This is the percentage of RFPs submitted that end up as part of a winning deal.
Your win rate is primarily a reflection of how successful the sales team has been at closing deals that involved a proposal. RFPs get you into the conversation and onto the list, but the sales team takes it the rest of the way. However, proposal teams should still keep a close eye on win rate, as Jon Williams from Strategic Proposals explains.
“CEOs and sales leaders employ us to help win business – but you can’t measure a proposal team on win rates alone. There’s so much more that influences the outcome. But imagine your win rate is zero: would that feel right? No! Win rate has to be a critical part of the mix.”

✓ How to track it:
- In a CRM like Salesforce, run a report to see “deals won” with an RFP attached
- Then, divide the number of RFPs “won” by the total number submitted and multiply by 100
- You can also track the win rate through RFP response software. Simply mark winning projects as ‘won’ and the software automatically calculates your rate
✓ Decisions you can make with it:
- Predict how much revenue you can win (if your rate stays consistent)
- Determine who’s responsible for a revenue shortfall (if the win rate is low, the fault may lie outside of your team)
What is a good RFP win rate?
The average organization wins 47% of its RFPs, although win rates also tend to vary by company size. For example, enterprise companies win more frequently than small ones.
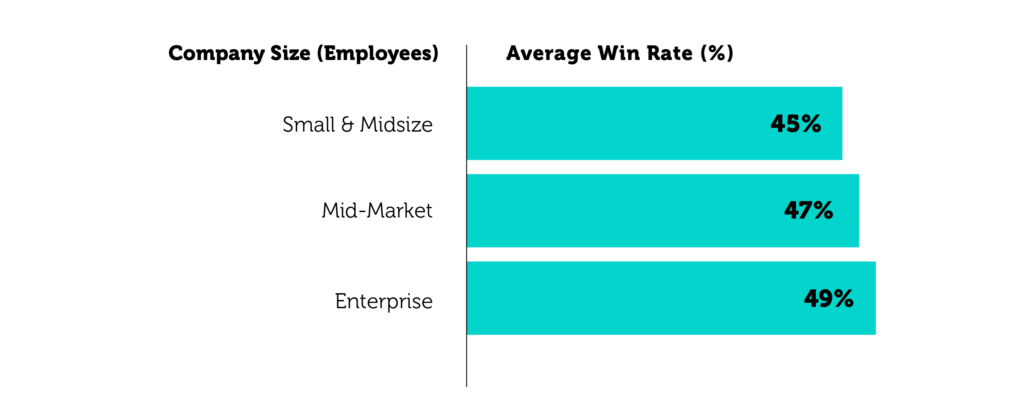
Source: Loopio’s 2021 RFP Response Trends & Benchmarks Report
Shortlist Rate (%)
This is the number of RFPs submitted where you were shortlisted by the buyer.
Shortlist rate is a much more accurate measurement of RFP quality than RFP win rate. It’s a pure measure of RFP success—having read your proposal and those of your competitors, the buyer selected yours to move to the next stage of consideration, which is typically a demonstration from the sales team.
✓ How to measure it:
- In your CRM, create a deal stage indicating that the buyer shortlisted you for this opportunity
- As a backup, use a spreadsheet to track this metric
✓ Decisions you can make with it:
- Determine whether your team is achieving successful outcomes (irrespective of win rate)
- Determine whether your process needs work (if the shortlist rate is low)
- Identify the parts of your process that may need attention (if the shortlist is high but the win rate is low, the issue lies somewhere else in the process)
How to successfully track shortlist rate 💡
Collect this information actively, by making it a “deal stage” in Salesforce, rather than passively, by requiring sales reps to check a box. If they’re busy, they’ll forget, and it’ll throw off your number.
Advancement Rate (%)
This is the percentage of RFPs that can move on to the next stage or “convert” for each stage in your RFP deal cycle.
Advancement rate (also known as progression rate) can show you how often your RFPs move to the next stage in the buying process. This metric is a wonderful opportunity to learn to speak the same language as your salespeople, as the stages should be drawn directly from, and map exactly to, their process (even if they have more stages).
| Example stages: |
| Sales funnel -> RFP submission -> Shortlist -> Demo/Interview -> Opportunity won |
When you measure these rates over time and establish benchmarks for your business, you can start to see where things fall off. For example, if the dropoff occurs right after the sales demo or interview, you can explore demo recordings for opportunities to improve.
Plus, the higher your conversions are from stage to stage, the fewer RFPs you need in your pipeline to achieve the same overall revenue. If your stages match the example below, and you know you have 150 RFPs for an average of $15,000 each, you can reasonably expect to win about $200,000 in revenue.
| Example stages: |
| Sales funnel -> RFP submission (65%) -> Shortlist (55%) -> Demo/Interview (50%) -> Opportunity won (50%) |
✓ How to track it:
- Start by tracking how many deals progressed to the next stage over a time period
- Compare this number to how many were lost over the same period
- Then, divide that number by the total number of deals in the previous stage and multiply by 100 to calculate your advancement rate
- You can do this easily by creating the appropriate deal stages in your CRM. Then create a dashboard that displays the percentage of deals that progress between each stage
✓ Decisions you can make with it:
- Forecast RFP revenue (if you have accurate benchmarks)
- Identify issue areas in your RFP response or sales process
- Identify areas in your RFP response process where you can save time
“One metric that we’re doubling down on is our advancement rate. Our sales cycles are long, and it can take months after submitting the RFP before the customer makes a decision. But we can find out pretty quickly if we advance to the next round."

Overall Revenue from RFPs ($)
This is the total dollar value your organization has gained from deals involving an RFP.
It tells you how much revenue your RFP team is helping to generate. If taken as a percentage of total company revenue, it gives you a sense of the relative importance of proposals as a channel. Or, if the percentage of RFP revenue to total revenue is lower than the industry standard, it could be used to make a case for more resources.
✓ How to track it:
- Add up the total dollar value of all the deals in your CRM that include an RFP
- To do this, you’ll need salespeople to mark which deals involved an RFP, or mark it yourself
- Once you’ve marked all the “deals won” that include an RFP, build a dashboard that showcases how much revenue you’ve influenced
✓ Decisions you can make with it:
- Make a case that your RFP program has more potential (if advancement rate is high, but win rate low)
- Whether the RFP team needs more resources

What’s the best way to track RFP revenue?
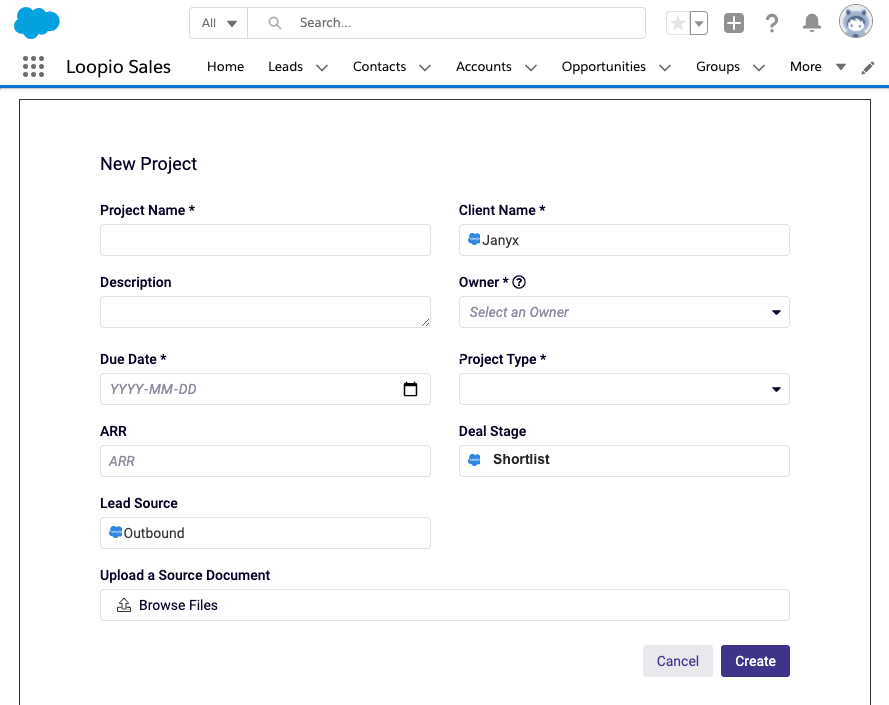
Just like the sales team tracking deals, your team should proactively measure your proposal pipeline. Use a CRM like Salesforce for a centralized approach to monitoring company revenue. And if you use proposal or due diligence software, you can sync those two tools together for easier reporting. For example: using the Loopio-Salesforce integration, run a report on opportunities tied to RFP projects—and see how much pipeline is tied to proposals.
Cost Per Bid ($)
This is how much it costs your organization to reply to an RFP, including time, materials, software licenses, and anything that goes into responding.
Knowing your cost per bid helps you calculate your return on investment (ROI) on responding to RFPs. If your cost per bid is $6,000 (not an unreasonable estimate), and the value of the RFP is only $6,000, you know not to respond because you’d likely only break even. Cost per bid also tells you how resource-efficient your team is.
Industry expert, Ben Klein, says the cost of the bid should be no higher than 5 percent of the value of the contract. In fact, you’re often looking for lower, in the 0.5 to 2 percent range.
| Common costs include: |
|
✓ How to track it:
- Calculate the cost of all your resources devoted to each bid, and add it all together
- Then, divide that number by the total bids (this gives you an average cost per bid)
- If you really want to be precise, track your cost per bid for different types of bids—for instance, the average cost of a government bid versus a private sector bid
✓ Decisions you can make with it:
- Determine if you can spend more resources on each RFP (if the ROI is high)
- Determine if you’re spending too many resources on each RFP (if the ROI is low)
"Calculating cost per bid drives more informed decisions. If a company is doing 50 submissions and each costs ten grand in resources, suddenly that’s a half-a-million-dollar budget. That gets people thinking differently."

Opportunity Ratio (%)
This is the percentage of revenue you stand to gain after accounting for cost per bid.
This RFP metric estimates the relative reward of each RFP, and the higher the better. An opportunity ratio of 60 percent means on a $10,000 RFP, you would make $6,000 in profit. Knowing this helps you decide which RFPs to prioritize.
Let’s say you can only respond to one RFP, and you could either spend 15 hours on a $5,000 deal or 25 hours on a $200,000 deal. If you weigh the opportunity ratios, you’ll be able to make a clear decision and justify it to others. (And likely, you’ll pick the second one.)
✓ How to track it:
- Subtract the cost per bid you’ve calculated from the total revenue for this opportunity
- Divide that difference—the amount you stand to gain—by the total revenue for this opportunity
- Finally, multiply by 100 and the result is your opportunity ratio percentage
- If you want to become even more accurate, you can factor in elements like the expected win rate based on opportunity characteristics (simply multiply the opportunity rate by the expected win rate)
✓ Decisions you can make with it:
- Decide whether or not to respond to an RFP
- Prioritize one RFP over another based on opportunity value
- Determine whether you need to be more efficient
- Decide that it’s time to end the cycle of reviews for the sake of cost

Chapter 4. Measuring the RFP Process
Process metrics allow you to explore the RFP process and identify areas where something isn’t working. For instance, if RFPs tend to be late, and you observe that time to second draft is twice as long as it was last quarter, that’s probably the area you need to investigate.
The challenge with process metrics is they tend to require added participation from everyone involved. It’s difficult to know if an individual subject matter expert replied on time unless they tell you, unless you track it yourself, or unless you have a bid software that captures it automatically.
There are five response process metrics to track:
Number of Questions Per RFP (#)
This is the average number of questions you respond to per RFP.
This is a relative measurement of the length of the RFPs you respond to. Basically, it’s a proxy for how long an RFP will take and how much effort goes into it. Although every proposal contains varying levels of complexity, a benchmark estimate of time per question will help make better predict team resourcing in the long run.
✓ How to track it:
- Load the RFP into your response software to track the number of questions automatically
- Alternatively, you can count manually in a spreadsheet (although it’ll take considerably more time)
✓ What decisions you can make with it:
- Decide how long an RFP will take to complete (and resource accordingly)
- Gauge the number of questions that can be answered through RFP response software through a library of past answers
How many questions does an RFP have?
The average RFP has 115 questions and takes approximately 23 hours to complete—which means the average question takes 12 minutes to answer. So the next time you receive an RFP, estimate how long it will take to write by multiplying 12 minutes per question.
Time to First Draft (#)
This is the amount of time it takes your team on average to complete the first draft.
This RFP metric tells you (and everyone involved) how quickly your team turned around the first draft. Less time is not necessarily good unless it’s paired with results like a high shortlist rate. That’s because speeding through could cause you to cut corners and produce a response of lower quality. What you want here is a healthy number—not necessarily the lowest possible number—and one correlated with a high shortlist or win rate.
✓ How to track it:
- Track how long it takes you to complete the first draft of an RFP
- You can do this automatically in an RFP or RFI software by tracking time elapsed between “project created” and the first draft being complete
- Alternatively, you can use a time tracking app like Toggl and record it in a shared spreadsheet.
✓ Decisions it will help you make:
- Whether you’re spending a healthy amount of time on the first draft
- Figure out what’s a normal timeline for your team
- Track what timelines correlate with a higher shortlist rate
How to track RFP timelines
It’s best to track this metric through a system that aligns with your team’s current process. For example, if you use RFP software, don’t ask your team to track time in a separate spreadsheet. Use functionality in that tool to minimize work (and provides less room for human error).
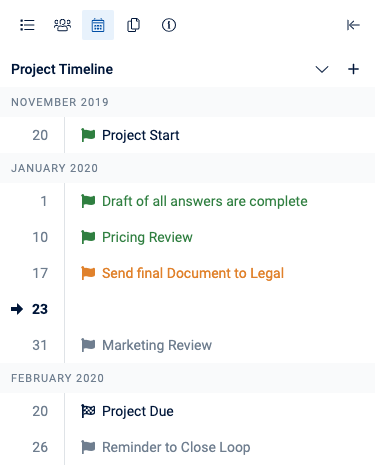
How to Track Milestones in Loopio’s Request for Proposal Software
Time to Second Draft (#)
This is the total time that elapses between the first and second draft submissions.
Just like the time to first draft, time to second draft gives you a sense of whether your team is spending an appropriate amount of time on a project. One of the leading causes of response process delay is from subject matter experts and reviewers taking too much time on their part. One way to address this is by tracking the response times of subject matter experts. Offer them tools and easy methods to do this that hold everyone accountable.
✓ How to track it:
- Track it automatically in your request for proposal software by monitoring the time elapsed between drafts
- Alternatively, ask your team to track time through CRM tasks or a project management tool like Asana
- As a last resort, track it in a spreadsheet
✓ Decisions it will help you make:
- Determine whether you’re spending a healthy amount of time on the second draft
- Determine whether second draft slowdowns are causing issues further down the line
- Helps you create SLAs (look at non-software specific terms for this) to safeguard your time and proactively communicate the performance of your department
“Give your SMEs as much time as humanly possible to answer questions. If I’m reviewing an RFP and I need their help, I’ll send them a message right away letting them know that I’ll be sending over questions to them later. My SMEs really appreciate the heads up so they can adjust their schedules.”

Overall Writing Time Per RFP (#)
This is the average amount of time your team spends writing an RFP.
Long or short writing times aren’t necessarily bad—what matters is finding a number that’s healthy for your business and which leads to a high shortlist rate. If shortlist rates are low, you probably aren’t spending enough time writing RFPs.
✓ How to track it:
- Ask your team to track time using RFP response software or a project management tool
- You may also track time spent writing new content—which should drop as you build your sales library of reusable answers
- To get a more precise calculation, you can also track the writing time for each question in an RFP
✓ Decisions you can make with it:
- Estimate how long an RFP will take to complete (if you know the average number of questions)
- Decide to spend more time writing RFPs (if win rates are low, and feedback from prospects mentions poor writing)
- Decide whether you need to automate more RFP responses to give writers more time per question
How much time does it take to answer an RFP?
The average amount of time spent writing an RFP is 23 hours. That said, this number varies by company size, as small businesses spend 8 hours less writing than enterprise companies.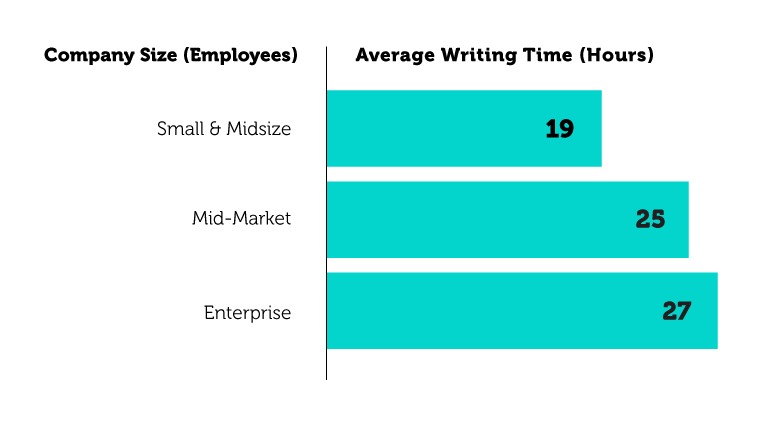 Source: Loopio’s 2021 RFP Response Trends & Benchmarks Report
Total Turnaround Time
This is the total time it takes to respond to an RFP, from notification to submission.
This helps you plan and resource your RFP responses. It’s the parent metric to others such as time spent writing and puts those RFP metrics into context. If your time spent responding to RFPs is relatively low—and so is your advancement rate—perhaps you should take more time. Or if more time isn’t possible, investigate how you might save time by eliminating unimportant steps, such as waiting for approvals.
✓ How to measure it:
- Track how much time each RFP takes from start to finish and take the average
- RFP response software does this automatically, but you can also manually track in a project management tool or spreadsheet
- Measure RFPs, RFIs, and DDQs separately (DDQs tend to be more repetitive, which could throw off your average)
✓ Decisions it helps you make:
- Determine consistency—if completion speed varies widely, you may have process issues
- Forecast whether you’ll be able to meet an RFP deadline before you take on the bid
- Estimate the time needed to reply to an RFP and establish SLAs for how much advance notice you need before the submission date
What’s the average RFP turnaround time?
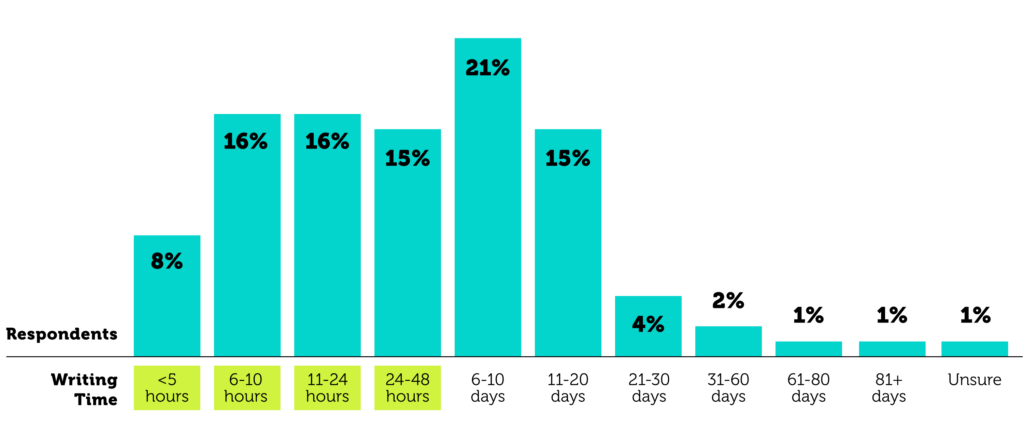
RFP statistics show that the majority of teams are turning around proposals in less than 48 hours. Considering the average RFP involves 9 people, this is shockingly speedy.
Source: Loopio’s 2021 RFP Response Trends & Benchmarks Report

Chapter 5. Improving Your RFP Content with Data
Highly effective proposal management teams know that clear, well-written answers lay the foundation for a successful proposal. This is why measuring the performance of your answers (a.k.a content) is critical.
Understanding where your content is performing well (and where it needs improvement) will help your team scale improvements across all proposals. To truly improve content through data, you’ll need a library of reusable responses that your whole team has access to.
There are four content metrics to track:
Content Usage (%)
This is a measurement of how often specific answers are used (and reused) when responding to RFPs.
Content usage tells you what your most common and important answers are. If an answer is used in 90 percent of RFPs, and you’re trying to prioritize the time you plan to spend improving your library, that’s the place to start. Small improvements there can have a big effect on the overall program. Similarly, if some answers are never used, investigate why, and either rewrite or consider retiring them.
✓ How to track it:
- Content usage rate is tricky to calculate unless you have an RFP response software that tracks which answers it fills in automatically
- You can count content usage manually in a spreadsheet, but be sure to note which RFPs each response appeared in
✓ Decisions you can make with it:
- Prioritize the answers that need updating
- Identify old answers that should be rewritten or retired
- Inform the greater team which products are of greatest interest based on how often they appear in proposals, plus how those trends are shifting

Content Freshness (#)
This is a measure of how recently an RFP answer has been reviewed or updated.
Content freshness can be an indicator of whether it’s safe to use an answer in your latest proposal. Every company has a different level of what’s considered healthy for content freshness, but a declining freshness score tells you that you’re writing more and more new answers for each proposal, which suggests that the ones in your library are out of date, or “stale.”
A score of zero means your library is completely stale. A score of 100 means it’s perfectly up-to-date. Make updating your content part of your review process or it’ll grow into a project so large nobody wants to tackle it.
✓ How to track it:
- This metric is difficult to track without an RFP response software to do it for you
- If tracking it in a spreadsheet, create a column next to each answer for recording how many times it was used. Divide that number by the total number of RFPs and multiply by 100
- Then, average the rate for all questions to create one overall score. When finished, mark the date of your last content review, so you’ll remember what was included next time you return
✓ Decisions you can make with it:
- Decide whether it’s time to update your content
- Decide whether to respond to industry changes (based on a declining freshness rate)
- Decide whether you need more resources (if tied with a declining selection or win rate)

The hidden benefit of content freshness
While this metric isn’t typically scrutinized by leadership, it does help solve for a very important mission: reducing legal risk. If your answers are stale, it could mean you’re about to put outdated information into the agreement, which could create a spiral of legal, privacy, and security issues. Fresh answers help ensure your answers stay compliant.
Content Performance (%)
This metric can take several forms, but the most common is a bar graph showing the reported reasons for winning or losing RFPs.
Without win/loss insights, it’s difficult to know what to change after losing an RFP. You can track people’s responses by role to reveal disparities in how the teams work together. Qualtrics, the leader in experience management, sends surveys after each of its proposals to collect this data.
✓ How to track it:
- Create a consistent feedback loop for your proposals (or at the very least, your priority deals)
- After a deal is marked as “won” or “lost” in Salesforce, trigger a request for feedback to the contacts involved
- For the highest-fidelity picture, gather data that covers all deals, but also spend the time to interview participants on qualitative insights
- Using a tool like Clozd can help streamline win/loss analysis
✓ Decisions you can make with it:
- Identify areas in your process to improve, such as pricing
- Identify individual questions that tend to perform well
- Identify individual questions that tend not to perform well
- Identify sections in the proposal that aren’t performing well. (For example, things your team consistently performs poorly on)
- If you track responses by role, identify areas of misalignment, and facilitate a dialog

How to gracefully gather feedback
- Ask three priority questions to help you improve—but no more. Be specific.
- Draft a post-RFP survey (or form) that’s easy to submit in a couple of minutes.
- It’s OK to politely follow up. People are busy, but usually, they do want to help.
Source: How to Answer RFP Questions, According to Procurement Pros
To collect broad win/loss data, send a survey after each RFP which asks, “Why did we win/lose this RFP?” and allows people to select multiple factors. Aggregate the responses over time to produce a bar graph. You can do this automatically in an RFP response software, or a survey tool. (Additionally, some organizations who evaluate your RFP may provide you with the scores they gave each of your questions—collect those in one place.)
To collect narrow data, proactively schedule interviews for after the deal closes, with both the salesperson and, if possible, with the client (separately). Use the opportunity to go deep and invite candid, unfiltered feedback. Cross-reference this information with your aggregate survey information. Do any of the rationales explain what you’re seeing in the survey?
“It’s best when the supplier approaches that opportunity to have a debrief as a learning opportunity, opposed to questioning the decision.”

Content Answer Automation (%)
This is a measure of how many of your RFP answers are automatically added to your proposal—that is, inserted by software, rather than you having to manually copy and paste.
An answer is considered “automated” if you can do one of the following:
- Auto-fill it in just a couple of clicks
- Find the answer by searching for it within one central answer library
- Automatically assign content updates, edits, and approvals to SMEs
- Auto-detect if the answer was up-to-date
✓ How to measure it:
- A proposal automation or response software will track this automatically
- If you’re using a spreadsheet to track it, keep a tally of how many of the answers you copy-and-pasted for each RFP, and divide that number by the total number of answers
- Be sure to track it over a period of time for an accurate average.
✓ Decisions you can make with it:
- Determine how much time your team is saving thanks to automation (and how much more RFP revenue that can lead to)
- Determine whether your investment in an RFP response software is paying off
- Determine whether your answer library is fresh enough (if the automation is low, it’s an indicator that freshness is below what it could be)
- Determine whether you need more resources (if the automation rate is declining, more writing is in your future)
Three signs you need answer automation
How do you know if you need RFP automation? You meet these criteria.
- Do you answer 1 or more RFP per month?
- Do you work with 5 or more contributors?
- Is your average question repetition 40% or higher?
Proposal automation is a measure of your team’s effectiveness at eliminating busywork. If you have an automation tool into which you can input an RFP and have it fill out the answers for you, it’ll save time, reduces the cognitive burden of responding, and free you up for more strategic work that can’t be automated.
Long-term, automation can be your path to promotion. Individuals who systematize their work in a way that frees them to think strategically creates a path for advancement.

Chapter 6. The People Behind Your RFPs
People metrics are perhaps the most underestimated metric of RFP performance. There are two important things to know about measuring these outcomes. The first is that they should never be used to punish or blame. All that can do is lower morale. These metrics should only be used to suggest and guide.
Second, it’s important to track qualitative people metrics, too. Most RFP teams focus on the quantitative stuff—how long people took to respond, how many RFPs they touched, and more. But what about how contributors felt?
Without a sense of whether your SMEs are facing unforeseen roadblocks, there’s no understanding if their deadlines are realistic. Use people metrics to ask how they feel and give them a part in building a better RFP response process.
There are four people metrics to track:
Number of Collaborators (#)
This is the average number of collaborators that work on a single proposal response.
The number of collaborators can signify a few things about the efficiency (or inefficiency) of your process. There’s an ideal number for your business, above which, it’s too many people, and they’ll only work slower and produce lower quality work. And there’s a number below which you’re not getting a sufficient diversity of opinions, and the answers won’t be as accurate or specific.
✓ How to track it:
- Track the total number of people who participated in each RFP, and take an average over a period of several months
- If you can, track who exactly contributed, their role, and even who contributed by question, so you can get a sense not only of how many people contributed, but why they were needed
- RFP software will track this automatically. A step-down option is tagging the appropriate people in a project management software or recording contributors in a spreadsheet
✓ Decisions you can make with it:
- Investigate whether the team is too small, or too large, in comparison to the volume of RFPs you produce
- Decide whether to set a limit on the maximum number of collaborators
- Decide who precisely needs to be involved in an RFP and resource appropriately
How many people does it take to complete an RFP?
The average RFP team involves nine collaborators. But team size also grows with company size, which is likely a reflection of the resources available to complete an RFP.
Source: 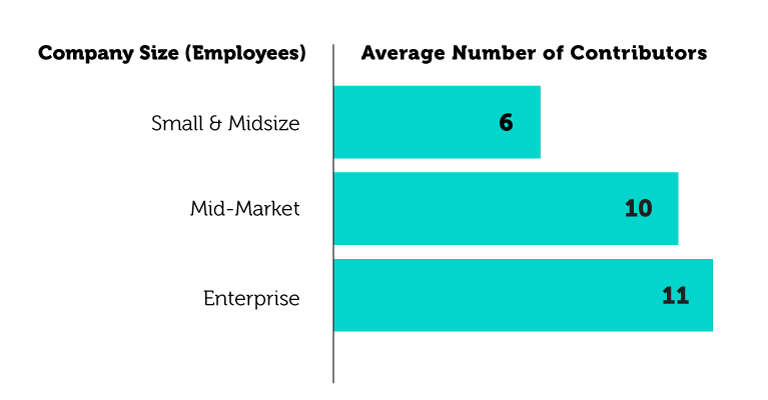 Loopio’s 2021 RFP Response Trends & Benchmarks Report
Team Satisfaction (%)
This indicates how satisfied team members are with your RFP process. Even more important, it shows you if they’re dissatisfied and why.
This RFP metric helps you understand whether your contributors will want to continue contributing. They may have responded to this one grudgingly and vowed to never do it again, and unless you’re collecting satisfaction, you won’t know. Conversely, by reminding contributors that the RFP program is a work in progress, that you value their opinion, and that you plan to act upon what you learn from satisfaction surveys, you can encourage them to put up with some frustration and be part of improving the process.
✓ How to track it:
- Send surveys after each RFP and on a quarterly cadence using a survey tool like Google Forms, Typeform, or Qualtrics
✓ Decisions you can make with it:
- Determine how to improve your RFP response process for contributors
- Know when a contributor is upset so you can reach out and address the issue
- Understand how different parts of the RFP process lead to contributor satisfaction/dissatisfaction
Loopio’s 2021 Benchmarks Report uncovered an interesting correlation—spending more time on RFPs tends to make contributors happier because more time on a response tends to lead to winning. That validation can make all the effort worthwhile.
Remember: only measure if you can act on what you learn. Measurement is a tax on your collaborators. If you consistently ask why they’re dissatisfied, but don’t have any way of fixing those issues, you’ll break their trust, and make them more reluctant to participate.

Four questions to measure team satisfaction:
-
- Which department are you in?
- How much time did you spend on this RFP?
- How would you rate your experience with this project on a scale of 1 to 5?
- What would you change about the RFP process?
Team Capacity (#)
The amount of bandwidth that contributors have to complete an RFP.
This gives you a data-driven sense of how much capacity your team has, and whether you can take on more proposal projects. Knowing your capacity helps you set a start date and determine (based on total average response time) how long you’ll need—and whether you’re cutting it close.
There are two ways to track this metric. Either calculate it based on overall RFP team capacity or based on individual contributor capacity. Unless yours is a mature organization, we recommend starting with measuring team capacity—it’s simpler.
✓ How to measure RFP team capacity:
- In your CRM, input the number of RFPs your team can complete weekly and monthly
- Use a dashboard speedometer to show how you’re tracking against that number
- You can either calculate based on your team’s time or include other departments, like IT or legal
✓ How to measure individual contributor capacity:
- Track the number of answers assigned to each participant
- This provides a snapshot of their overall effort, as well as capacity, and you can use the disparity between individuals and their various capacities to determine who might need more training
✓ Decisions you can make with it:
- Decide when to assign and start new RFPs
- Decide whether to decline new RFPs (if you wouldn’t have time to do an adequate job)
- Manage and address team burnout
- Decide whether you need more resources (when combined with revenue metrics)
- Calculate how much revenue additional capacity could bring in
"A key metric that should be captured is the number of answers completed per RFP by person or team. This provides an overall snapshot of effort. It tells me where I need to provide more training, and most importantly, I can see where we might be overloading one person or team."

Forecasting Costs Saved Through Software Efficiencies ($)
This is the amount of cost you anticipate saving, based on the number of minutes you are currently saving thanks to proposal automation.
This metric tells you how efficiently your team repurposes answers and saves time using RFP software. This is particularly useful for making a case for more proposal automation tools. If you use an industry benchmark for the average number of responses automated, you can get a fairly accurate estimate for how much time (or money) an RFP automation software might save.
✓ How to track it:
- First, you’ll have to track the number of questions your tool answers for you
- Your content answer automation rate). Multiply that rate (30%, let’s say) by the average number of minutes spent on each question (12)
- Multiply that by the total number of questions (115). The result, 483 minutes saved per RFP, can then be multiplied by the per-minute employee pay rate to calculate savings
✓ Decisions you can make with it:
- Secure buy-in for using software to help you complete more RFPs
- Decide whether you should purchase a dedicated RFP response software to improve capacity
- Determine whether you’re getting a positive ROI on your proposal management software

Chapter 7. When to Use Each Proposal Metric
Now that you’re familiar with the 22 proposal metrics you can track, we’ll share exactly where you can begin using them throughout your RFP process, from beginning to end.
Begin by examining your current RFP process. What’s the first step you take? And what’s the second?
Make a list of steps that you normally take when answering an RFP. Then, line up the decisions you’d like to make (that could affect change) at each stage of your process. Finally, choose a metric you can measure that’ll inform decision-making for each step.
Below are some examples to get you started.
| Measure your | To decide if… | Using this metric |
| Intake process | You’re taking on too many bids | Participation rate (%) |
| Go/No- go process | There’s an ROI in responding | Opportunity ratio |
| Research process | You can reuse messaging from past proposals | Content performance |
| Kickoff process | Your team can take on a new RFP | Contributor capacity |
| First draft process | Your team’s productivity is trending up (or down) month-over-month | RFP writing time, time to the first draft |
| Second draft process | Approvals are slowing things down | Content performance, time to the second draft |
| Final proofread and quality assurance | You’re spending more time than usual, or less | RFP completion speed |
|
Submission process |
Your RFP is providing a return on investment | RFP revenue, cost per bid |
Once you’ve picked the areas you’d like to focus on, download this RFP analytics template.
Filter the template down to the RFP metric you’d like to focus on. Then, diligently record your findings over the course of three months. After three months have passed, analyze trends in the data and share recommendations with leadership.
Remember: start small. Choose metrics that your team has control over, which will make a tangible impact on your work-life.

Chapter 8. Setting Up Your Process for Ongoing Success
To set yourself up for long-term success, it’s important to take a step back, and understand your process from start to finish.
Diagram precisely what happens (or what should happen) when an RFP comes in. Whose responsibility is it at each stage? Without clear distinctions, new RFPs tend to create a spiral of confusion where everyone waits for someone else to take it on. Or, salespeople wait until the last minute to tell the proposal team about an RFP.
-

Create a Consistent Intake Process
You’ll also want to implement what’s known as a go/no-go process if you don’t already have one. This is a checklist you can use to score new opportunities and quickly decide whether or not to respond. It’s a data-driven way to dedicate your efforts to the opportunities most likely to win, in order to conserve resources and save time.
Here’s an example RFP intake process:
- Sales notify the proposal team that an RFP is expected (before it is released)
- The RFP team stages the information in Salesforce and gauges team capacity
- Once the RFP is announced, Sales sends it to the RFP team within three days
- The RFP team assesses it based on the Go/No-go process
- The RFP team accepts the proposal and builds out a project plan, working back from 24 hours before the due date
-

Build Your RFP Dream Team
RFPs are a team sport. So to succeed in the long-term, it’s important to clearly define everyone’s role and tell them precisely what is expected of them.
There are two groups of roles in any RFP program—contributors and reviewers. You’ll need buy-in from your contributors to track RFP metrics like capacity, satisfaction, and win rate, as they’ll have to time themselves and record those numbers.
You’ll need buy-in from your reviewers on which metrics you should track, as they’re the ones who’ll likely be making decisions with them.
Contributors Those who directly contribute answers
Reviewers Those who review the RFP once created
- Sales team
- Proposal team
- Security team
- Subject matter experts (SMEs)
- Senior leadership
- Legal team
- Finance team
For each point on your RFP analytics process document, note who is responsible for delivering information and when, and who is accountable for reviewing it.
This creates accountability and helps people track down missing information. Learning more about the ideal bid team structure can help with this too.
-

Set Up Your Tools
Ideally, you already have these systems in place. But if not, here are a few tools we recommend.
- A system for measuring the proposal process: Use a CRM like Salesforce, Microsoft Dynamics, or similar to track incoming deals that include RFPs. (Ensure you’re capturing account owner, revenue earned, important proposal dates, sales stages, timeline, customer, and the region as part of that.) For a low-budget option, you could get by with a shared spreadsheet, though updating it may cut into your response time.
- A system for capturing content management: Designate a centralized place to capture RFP content (the RFP answers, graphics, etc.) and record RFP metrics. This is how you can track metrics across RFPs, recycle the best answers, and see what’s working. In some cases, a dedicated response software can help with proposal automation, automatically inputting answers. Whether you choose an RFP software like Loopio or file storage like Google Drive, Sharepoint, or Dropbox, this is a must.
You may also want to publish a shared RFP analytics document that outlines:
- Which RFP metrics you’ll track
- Who the data owners are (and their contact info)
- How often data is to be reported
- Who is responsible for providing input
- How the RFP metrics are to be analyzed
- How exceptions are to be handled
- What will happen when certain thresholds (like capacity) are reached
Finally, ensure you have a complete reporting schema that all stakeholders agree to. What information do they want to see? How will the information be reported throughout the organization?
Metrics on my Mind
As you learned at the start of this guide, the true measure of a metric is whether it helps you make a decision. If you take away nothing else from this guide, remember:
- Dashboards and tracking don’t mean much without a process to support them
- More isn’t necessarily better—it’s what helps you achieve selections and wins
- Don’t forget to ask people how satisfied they are, and how they’d improve the process
And above all, remember that you can reach out to your RFP community for support on how to measure these metrics anytime.